DO Studio : The interface to your drug discovery platform
1. Overview
DO Studio is Deep Origin's web interface for drug discovery research. It gives scientists a point-and-click environment for managing their data, running computational tools, and tracking results, all without needing to write code or manage cloud compute and storage. Everything you can do through the Deep Origin platform is accessible through Studio: uploading and browsing ligands and proteins, launching simulations, monitoring jobs, and reviewing outputs, all within a single, unified interface.

Diagram of the Deep Origin Platform, and its interactions with Studio and our API through projects.
For users who prefer to work programmatically, the same underlying platform is equally accessible via the Python client and REST API. Studio and the API are two front doors into the same system. Your data and projects are always in sync regardless of how you choose to work.
How it fits into the Deep Origin platform
Studio sits at the top of the Deep Origin platform stack. Beneath it, the platform is organized around three layers:
- Projects — The data organization layer. Where your ligands, proteins, simulation results, and file storage live.
- On-Demand Cloud Compute — The infrastructure layer that handles job submission, dynamic scaling, and managed cluster access, so you never need to think about provisioning resources.
- Tools — A suite of integrated scientific applications (such as pocket finder, docking, and FEP) that run on top of that compute infrastructure and write their results back into your project.
Studio is the lens through which you interact with your project, select and run tools, and analyze results as they come back. In order to learn more about accessing our platform via API, please visit our documentation : https://client-docs.deeporigin.io/index.html.
2. Getting Started
Logging in and authentication
DO Studio is accessible at https://login.deeporigin.io/. To log in, you'll need a Deep Origin account associated with your organization. If you don't have one yet, sign up for an account at https://os.deeporigin.io/signup.
Note: If you're accessing Studio as part of a trial or evaluation, your credentials may have been provided to you separately. Reach out to support@deeporigin.com if you're having trouble logging in.
3. Navigating the interface
When you first log into Studio, you will see a navigational bar on the left side, and a blank Dashboard.

A blank project, with the left-navigation bar and empty Dashboard (with Protein and Ligand tables, and a Mol* protein viewer)
The left sidebar is your primary way of moving around Studio. It's organized into three tiers, stacked from top to bottom. At the top, you'll see your organization, in the above example, “Example Organization”. This shows which org you're currently working within. If you are a member of multiple organizations, you can quickly switch between them by selecting one from the drop-down menu available on-click.
Directly below that is your active project (here it is “Example Project”). Below project, you will see links to different pages you can visit which are scoped to your currently loaded project:
- Dashboard — A dynamic overview of your current project's activity and current data.
- Balto — Deep Origin’s AI powered scientist
- Applications — The suite of computational tools available to run within your project, such as docking, pocket finder, or FEP.
- Datasets — A collection of hosted datasets from popular vendors and sources that can be brought into your project.
- Activity — A table of jobs and executions run within the current project.
At the very bottom of the sidebar, you'll find your user account, where you can manage your profile, settings, and billing information.
4. Projects
A project is a primary organizational unit in the Deep Origin Platform. It acts as a named, persistent workspace that groups together all the scientific data, molecules, proteins, and computational work associated with a particular research effort. A project may be focused around any number of topics, such as a specific target, campaign, or collaboration.
Every piece of work done on the platform is associated with a project. This ensures nothing gets lost, and that all activity is always traceable.
💡
If you are an existing user of Balto, your existing conversations will be accessible through your projects. To access your legacy chats:
- Create or open any project
- Access Balto through the left-navigation bar.
- Press the “Open sidebar” button at the top left of the Balto window. The legacy Balto chats are listed in the slide out drawer.
Projects contain multiple components:
- Ligands — A table of small molecules with their structures and any computed properties or metadata.
- Proteins — A table of protein structures and associated metadata and properties.
- Executions — A detailed log of every computational job run within the project, recording what was run, on which inputs, with which parameters, and by whom.
- Data files — All inputs and outputs generated by tools, stored in a read-only location so the record is permanent and auditable
Projects are scoped to your organization. Everyone in your org can see and load the projects that exist within it. When a project is loaded, it becomes the active context — any ligands you upload, proteins you reference, or tools you run will automatically be associated with it, and accessible via applications.
Creating a project
To create a named project, press the folder icon in the left-navigation bar and select “+ Create new project” from the dropdown. Select the “Create New” header and enter a name for the project in the “Project Name” field and press “Create”.
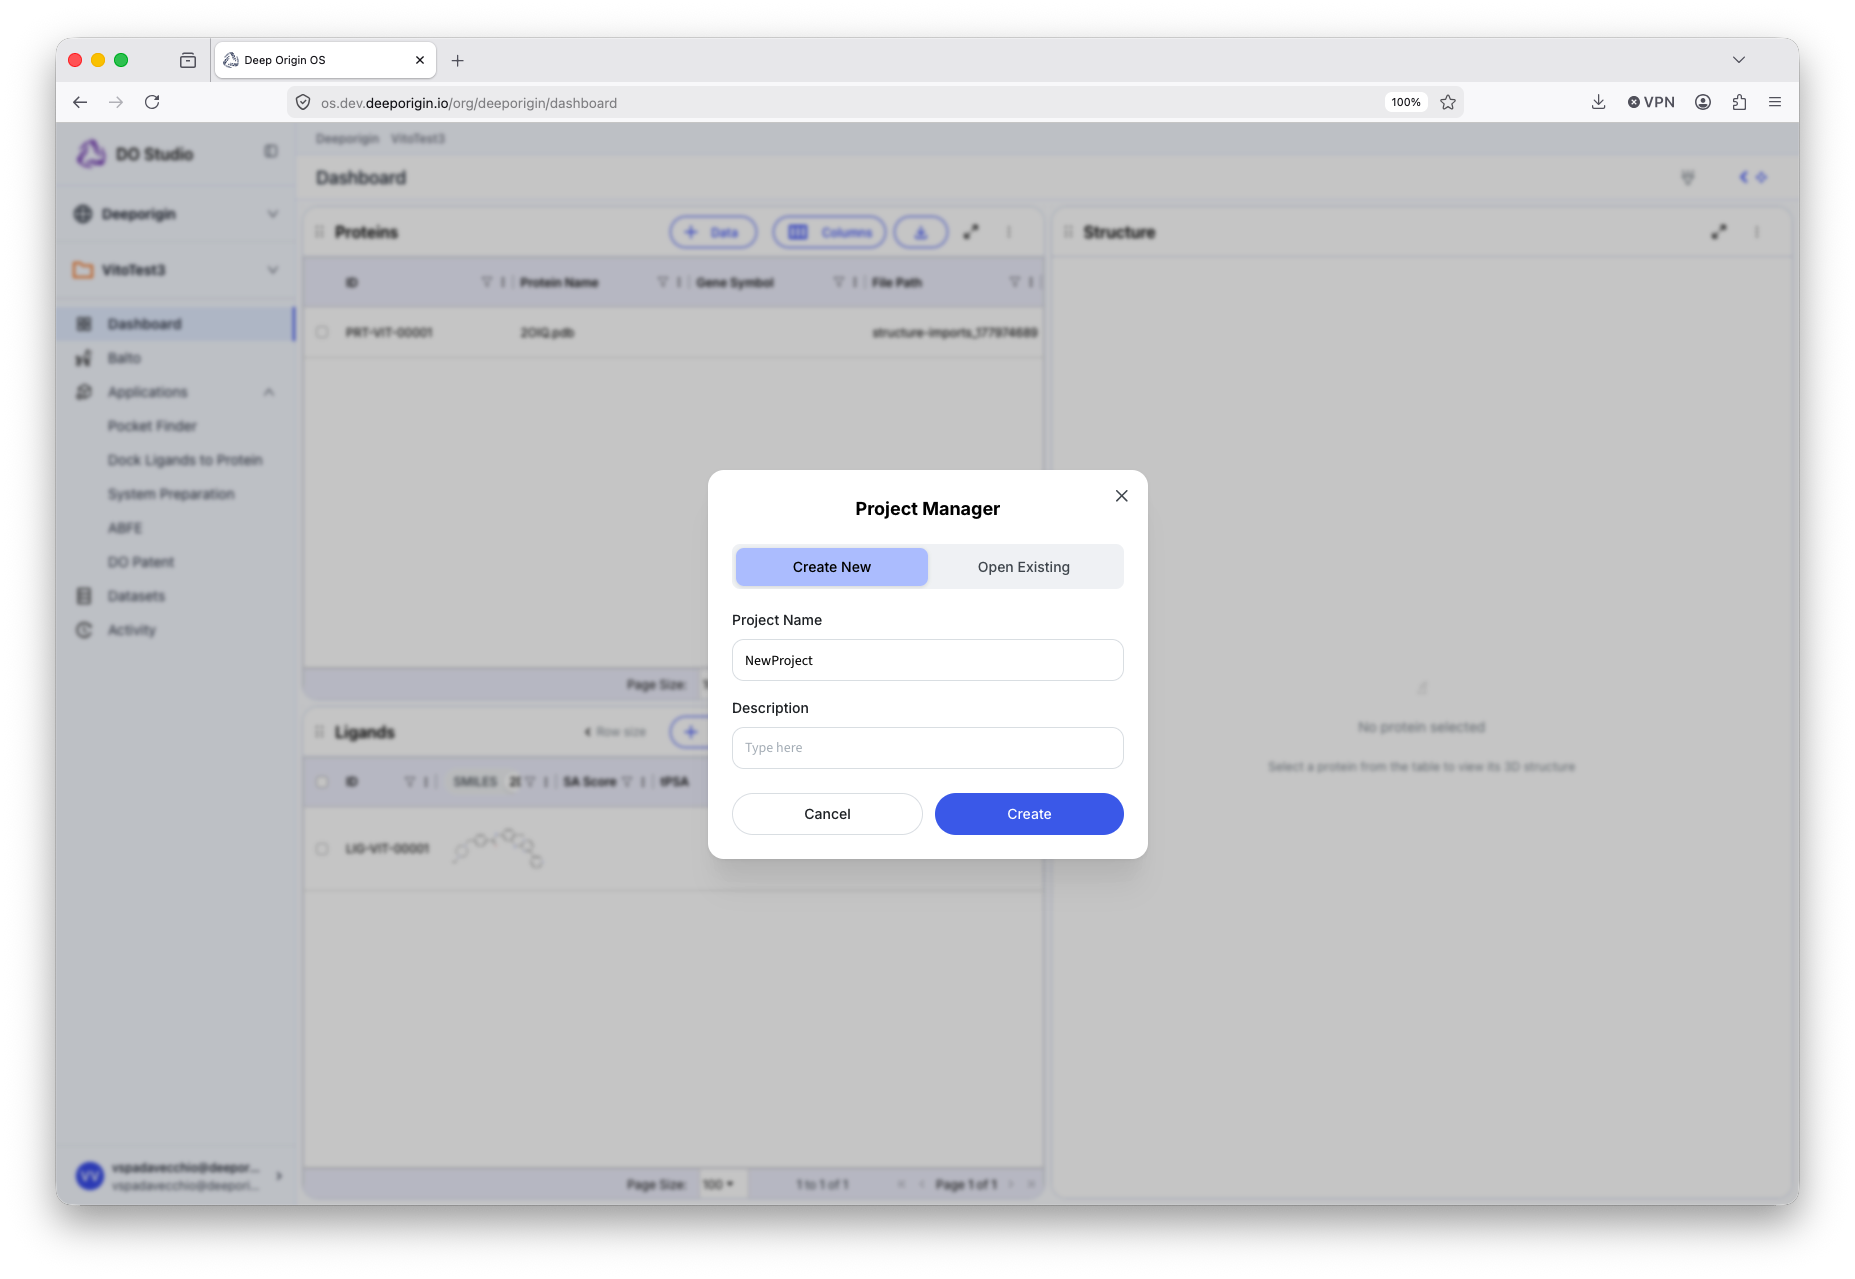
A named project is created and loaded.
Opening an existing project
Press the folder icon in the left-navigation bar and select the desired project from the drop-down list of projects, or select the project from the “Open Existing” tab of the Project Manager.
Deleting a project
Open the Project Manager, and with the “Open Existing” tab selected, press the trash icon next to the project name.
5. Using the Dashboard
The Dashboard page is a live view into a project. Whenever new data is uploaded or properties are calculated, the results will always end up in the Dashboard. This allows quick and easily visualization of Ligand or Protein data, structures, and plots.
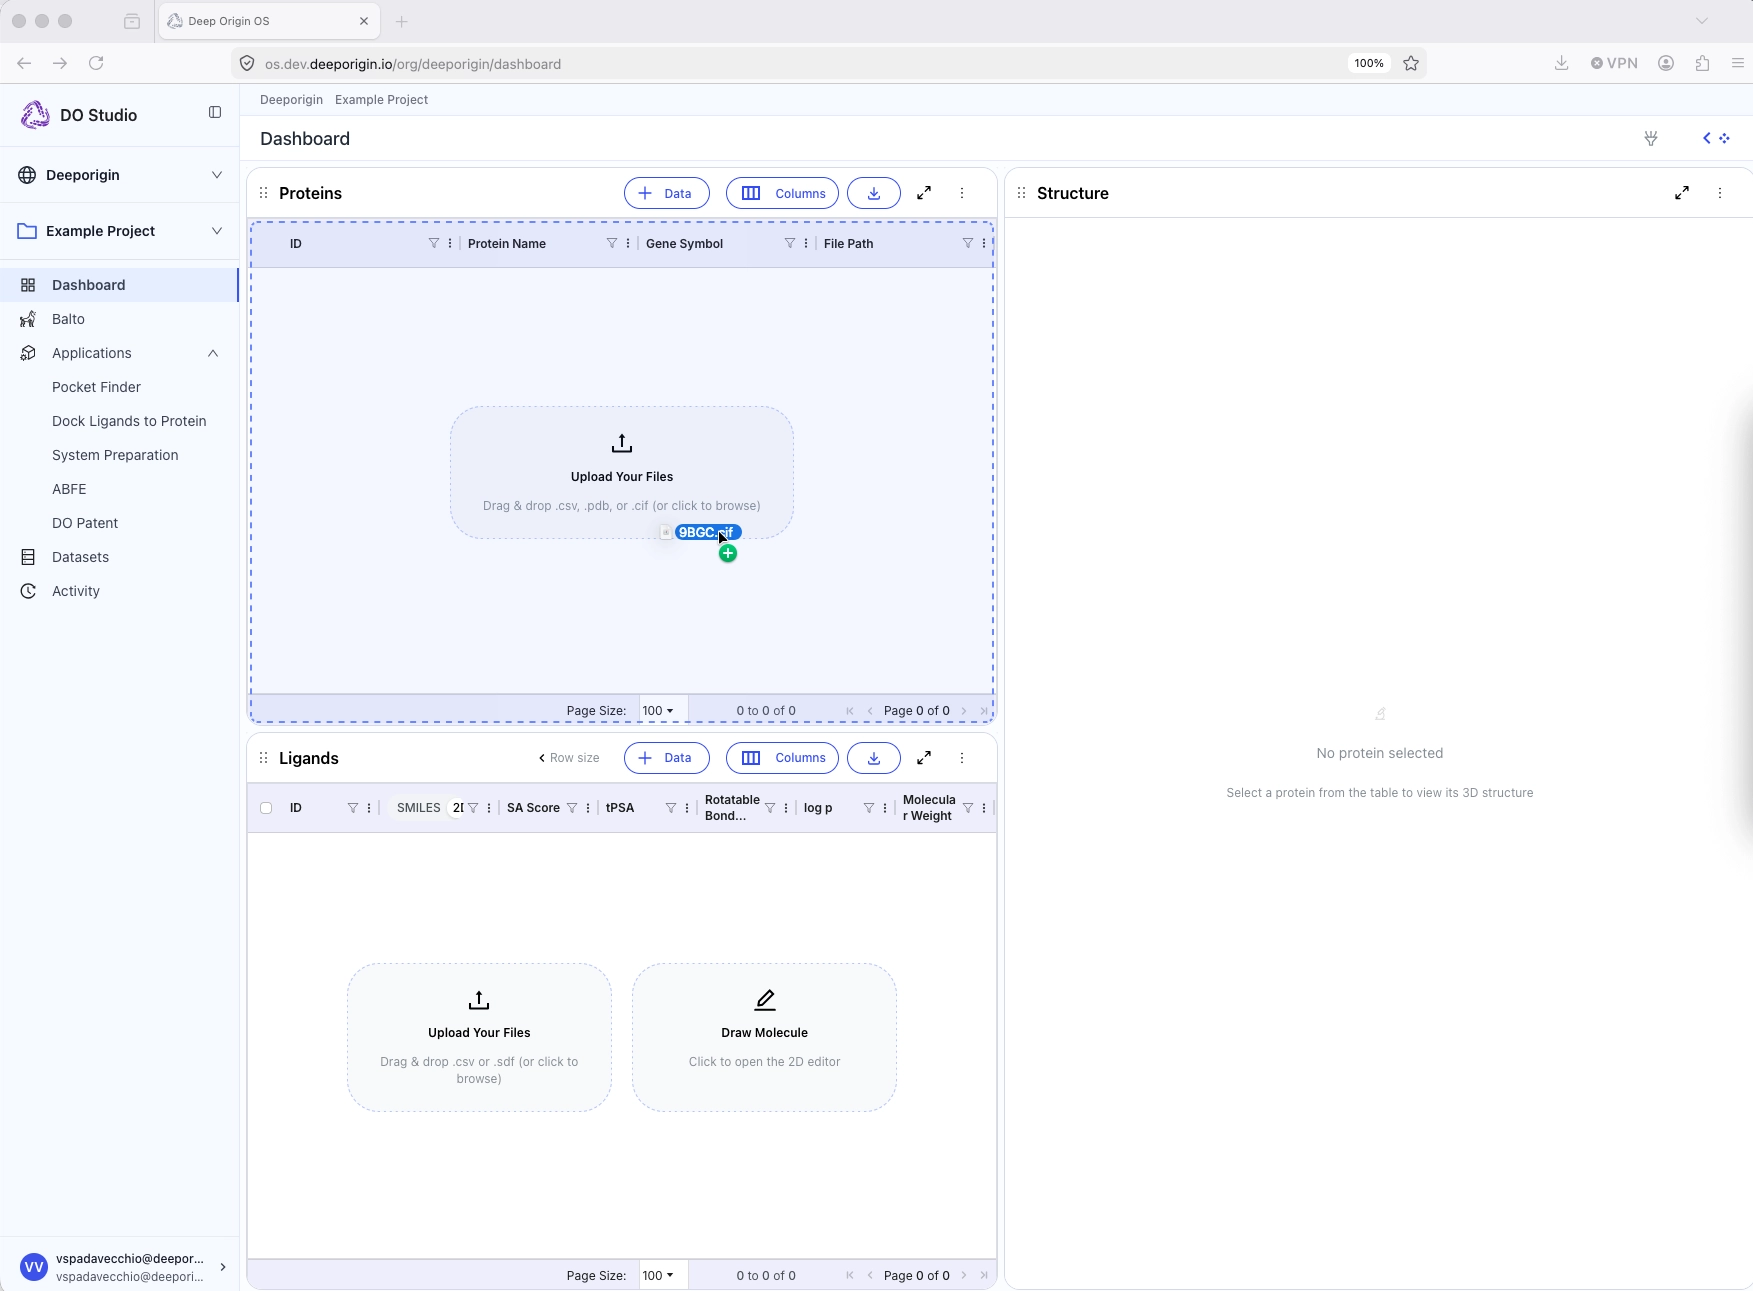
Uploading Protein Structures
Protein structures can be added to the Protein table by:
- Drag-and-dropping a file (
.pdb) into the table, or - Selecting “Upload File” from the “+ Data” drop-down menu in the Protein table header
💡
Whenever a Protein or Ligand are added to a project, they are assigned a unique project-scoped ID.
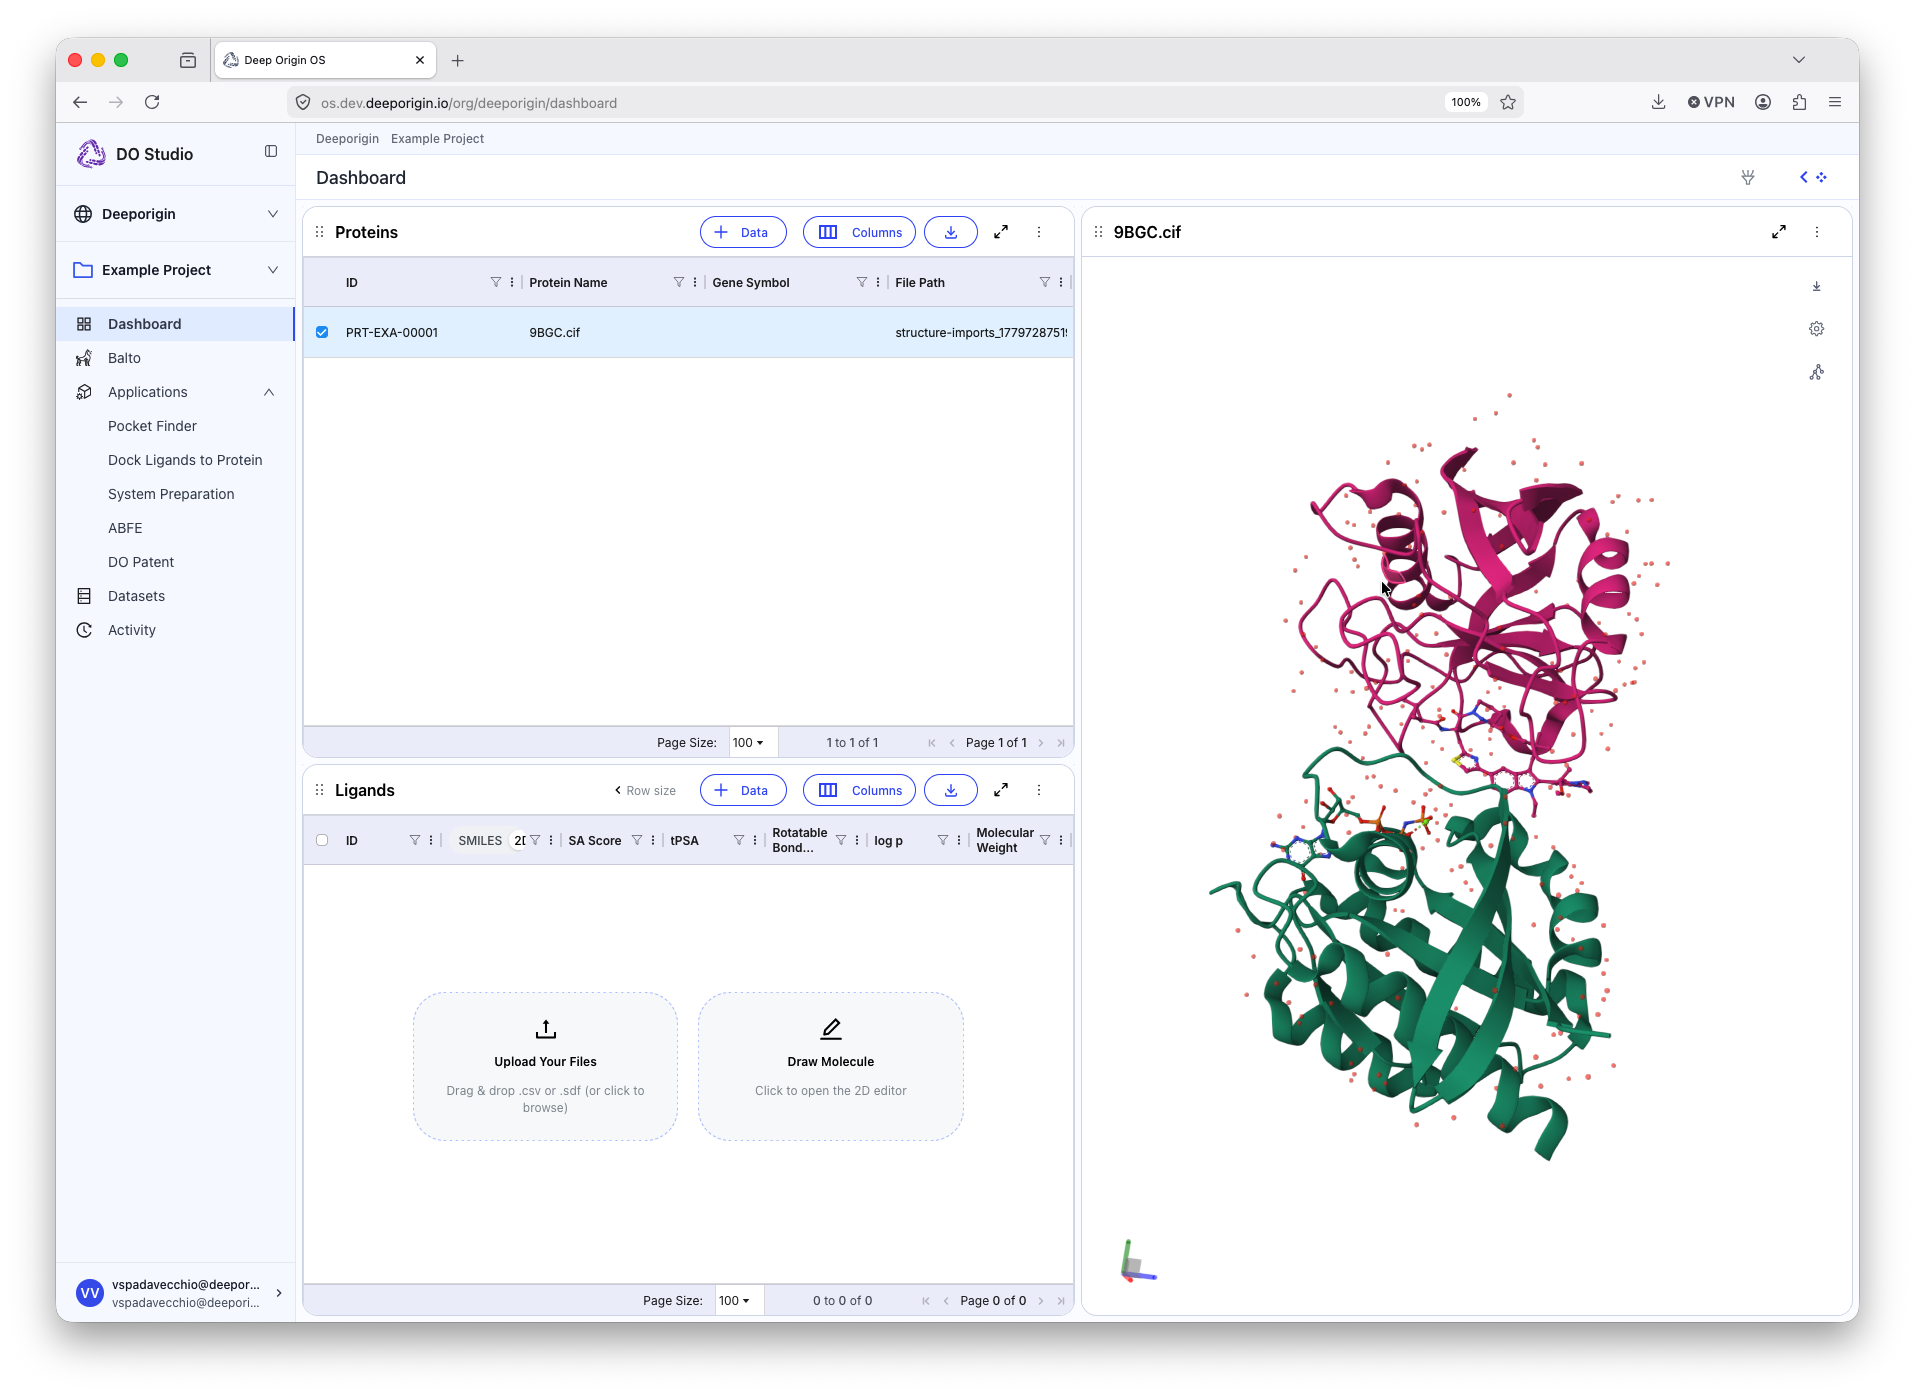
A new row is added to the Protein table. Select this row via the checkbox on the the left side of the row to reveal the structure in the protein viewer component.
Uploading Ligand Structures
Ligands can be added to the Ligand table by:
- Drag-and-dropping a
.csvfile into the table, or - Selecting “Draw Molecule” option from the “+ Data” drop-down, or
- Use the “Upload File” option from the “+ Data” drop-down
❗
When uploading a .csv file, one column must have SMILES patterns. All other data in the .csv will be mapped to existing columns in the Ligand table.
Managing columns in Protein and Ligand tables
All computed and imported properties for Ligands and Proteins are columnar data in their respective tables. Manage which columns are visualized in the table by pressing the “Columns” button in the table header.
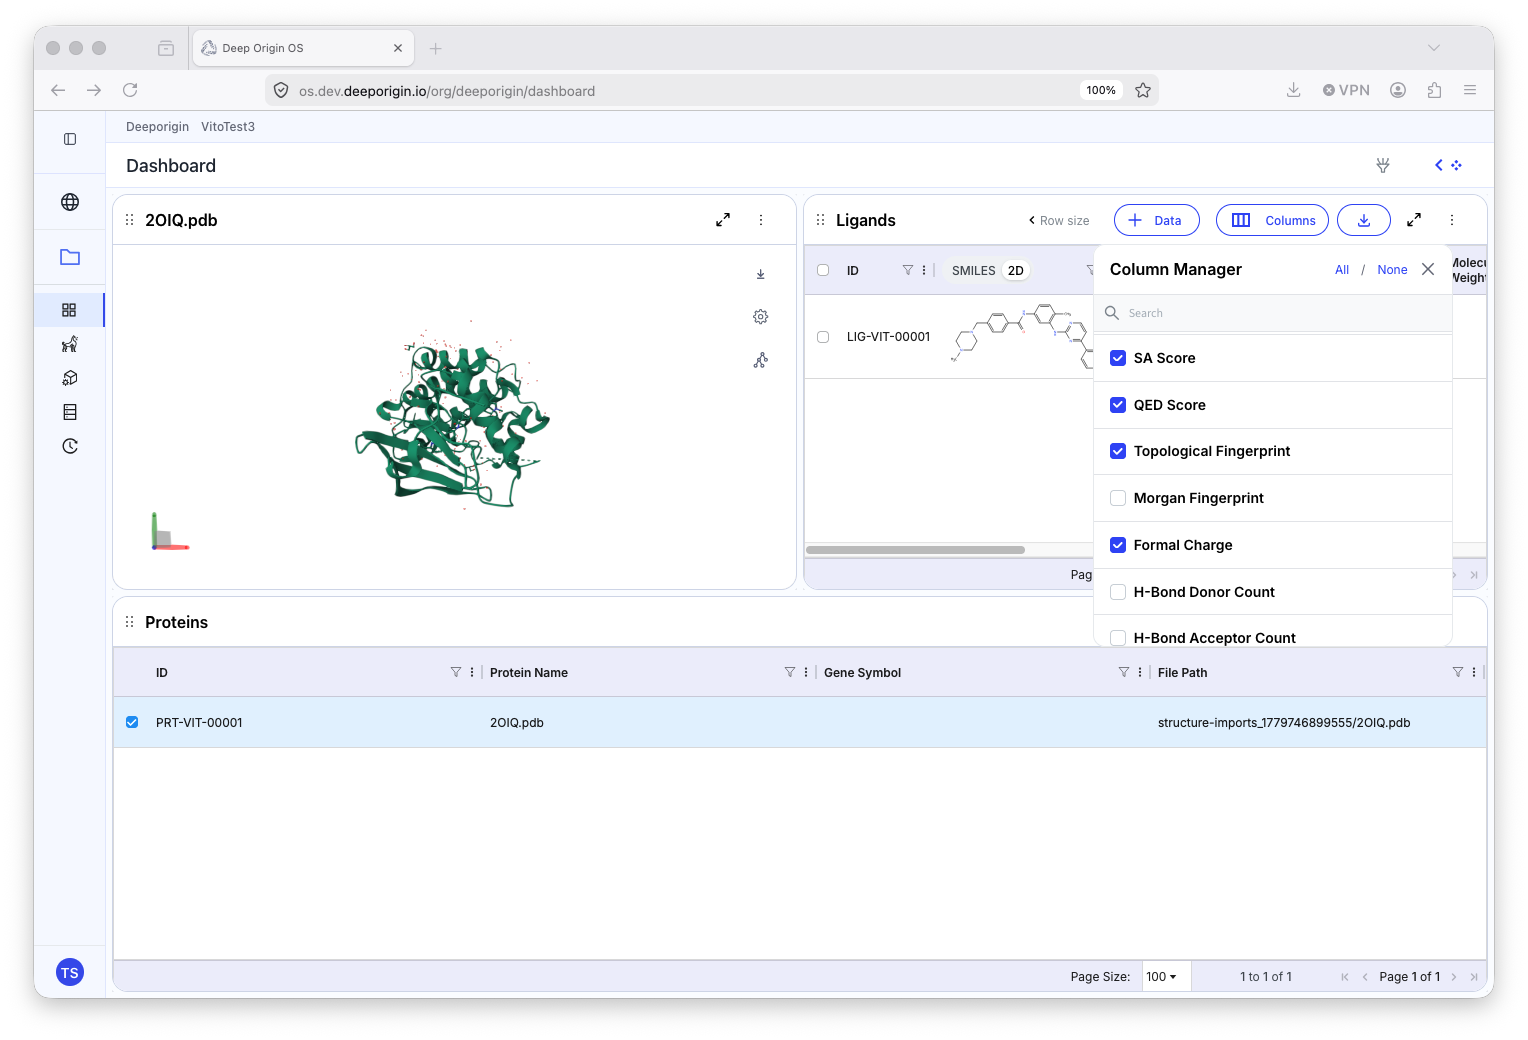
Select which column(s) are to be made visible.
Computed property names and columns
Most calculations run in Studio will create new properties (columns of data) in your Ligands or Proteins table. These columns have headers containing multiple parts to their label.

A header to a column in the Ligand table
The header describes:
- The protein name used in the calculation (”8BA3”)
- The name of the run (“JAK2_TestDock”)
- The type of values in the column (”PoseScore”)
These headers describe the simulation that created it. When submitting a job, you will often be asked to name the output property. This name can be thought of as a name for the particular simulation you are running, giving you another way to identify (above, this name is “JAK2_TestDock"
💡
Not all calculations in the Ligand table may use a protein as part of the calculation, so protein ID my not be found in all column headers
Many calculation columns can be grouped by the type of application that generated it. To group the results of a given tool, press the Column Manager button in the header of the table, identify the tool columns to be grouped, and select them. Next, toggle the button next to the tool name from a grey “U” to a blue “M”. Select the caret next to the toggle to reveal all of the grouped properties.
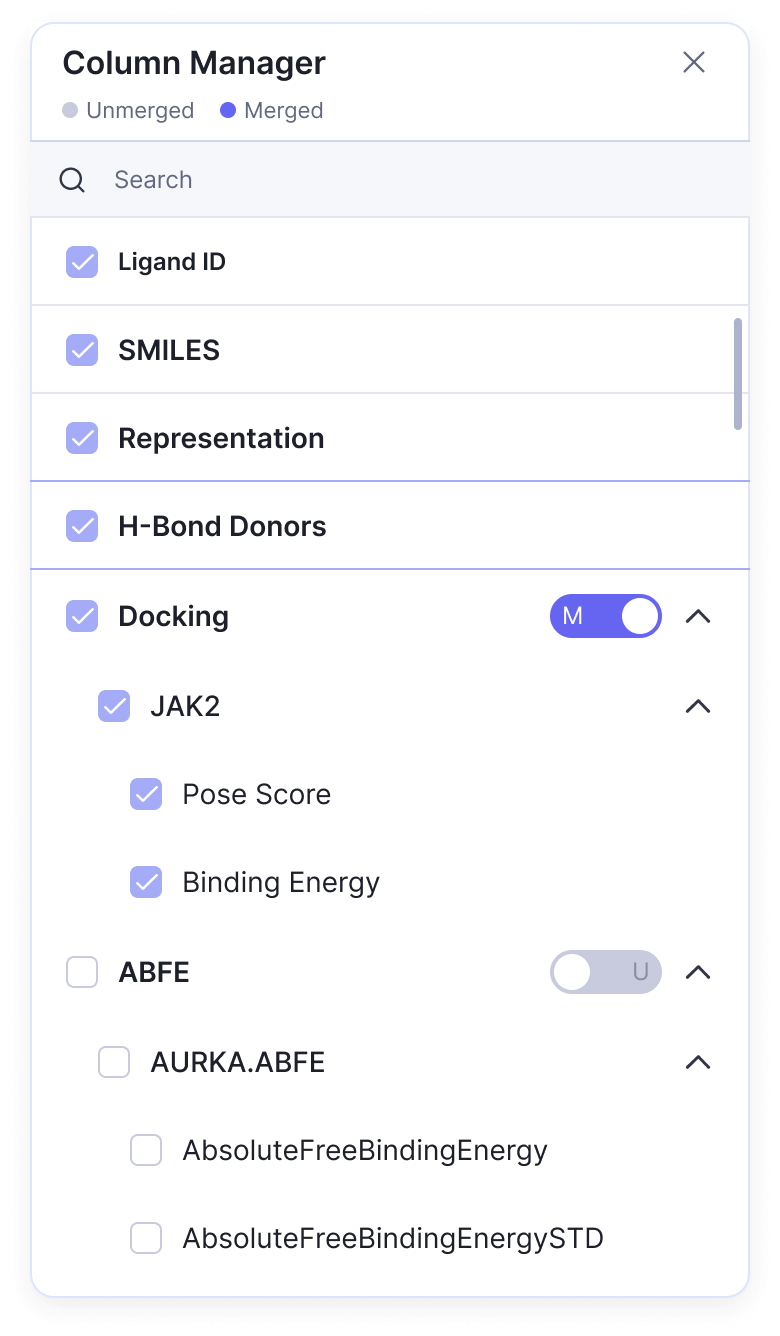
The Column Manager tool found on the Protein and Ligand tables.
Plotting data
To create a plot in the Dashboard, press the “Add Component” button in the top-right corner of the window to open the component drawer. Drag-and-drop the “Plot” component into the dashboard, or press the “+” icon in the Plot component card. This places a plot window in the Dashboard. Press the blue “Create New Plot” button, and follow the plotting wizard to plot data from either your Ligand or Protein table.
Arranging the Dashboard
Each component in your Dashboard can be arranged by size and position. To re-arrange the components in your Dashboard, hover your mouse over the header of the component you want to re-size or re-position. Click-and-hold your mouse button to grab that component and drag it around your Dashboard. Dragging the component around the dashboard reveals suggested layouts as blue boxes, indicating where the component will be and its rough dimensions when your mouse click is released.
To re-size a component, place your mouse on the edge of the component that you would like to re-size. Click-and-drag your mouse to re-size that component dynamically so that it has the desired size.
6. Applications
Applications are hosted scientific tools that run directly within Deep Origin's infrastructure. Each application is fully integrated with your project. Applications can read and write from your ligand and protein tables automatically, so results are always in context with the rest of your data.
Applications can be accessed in two ways:
- In the left-navigation bar, under the “Applications” section carrot, which will list all available applications. Select an application by clicking on its name.
- Click the “Applications” line itself, which will navigate you to the Applications page.
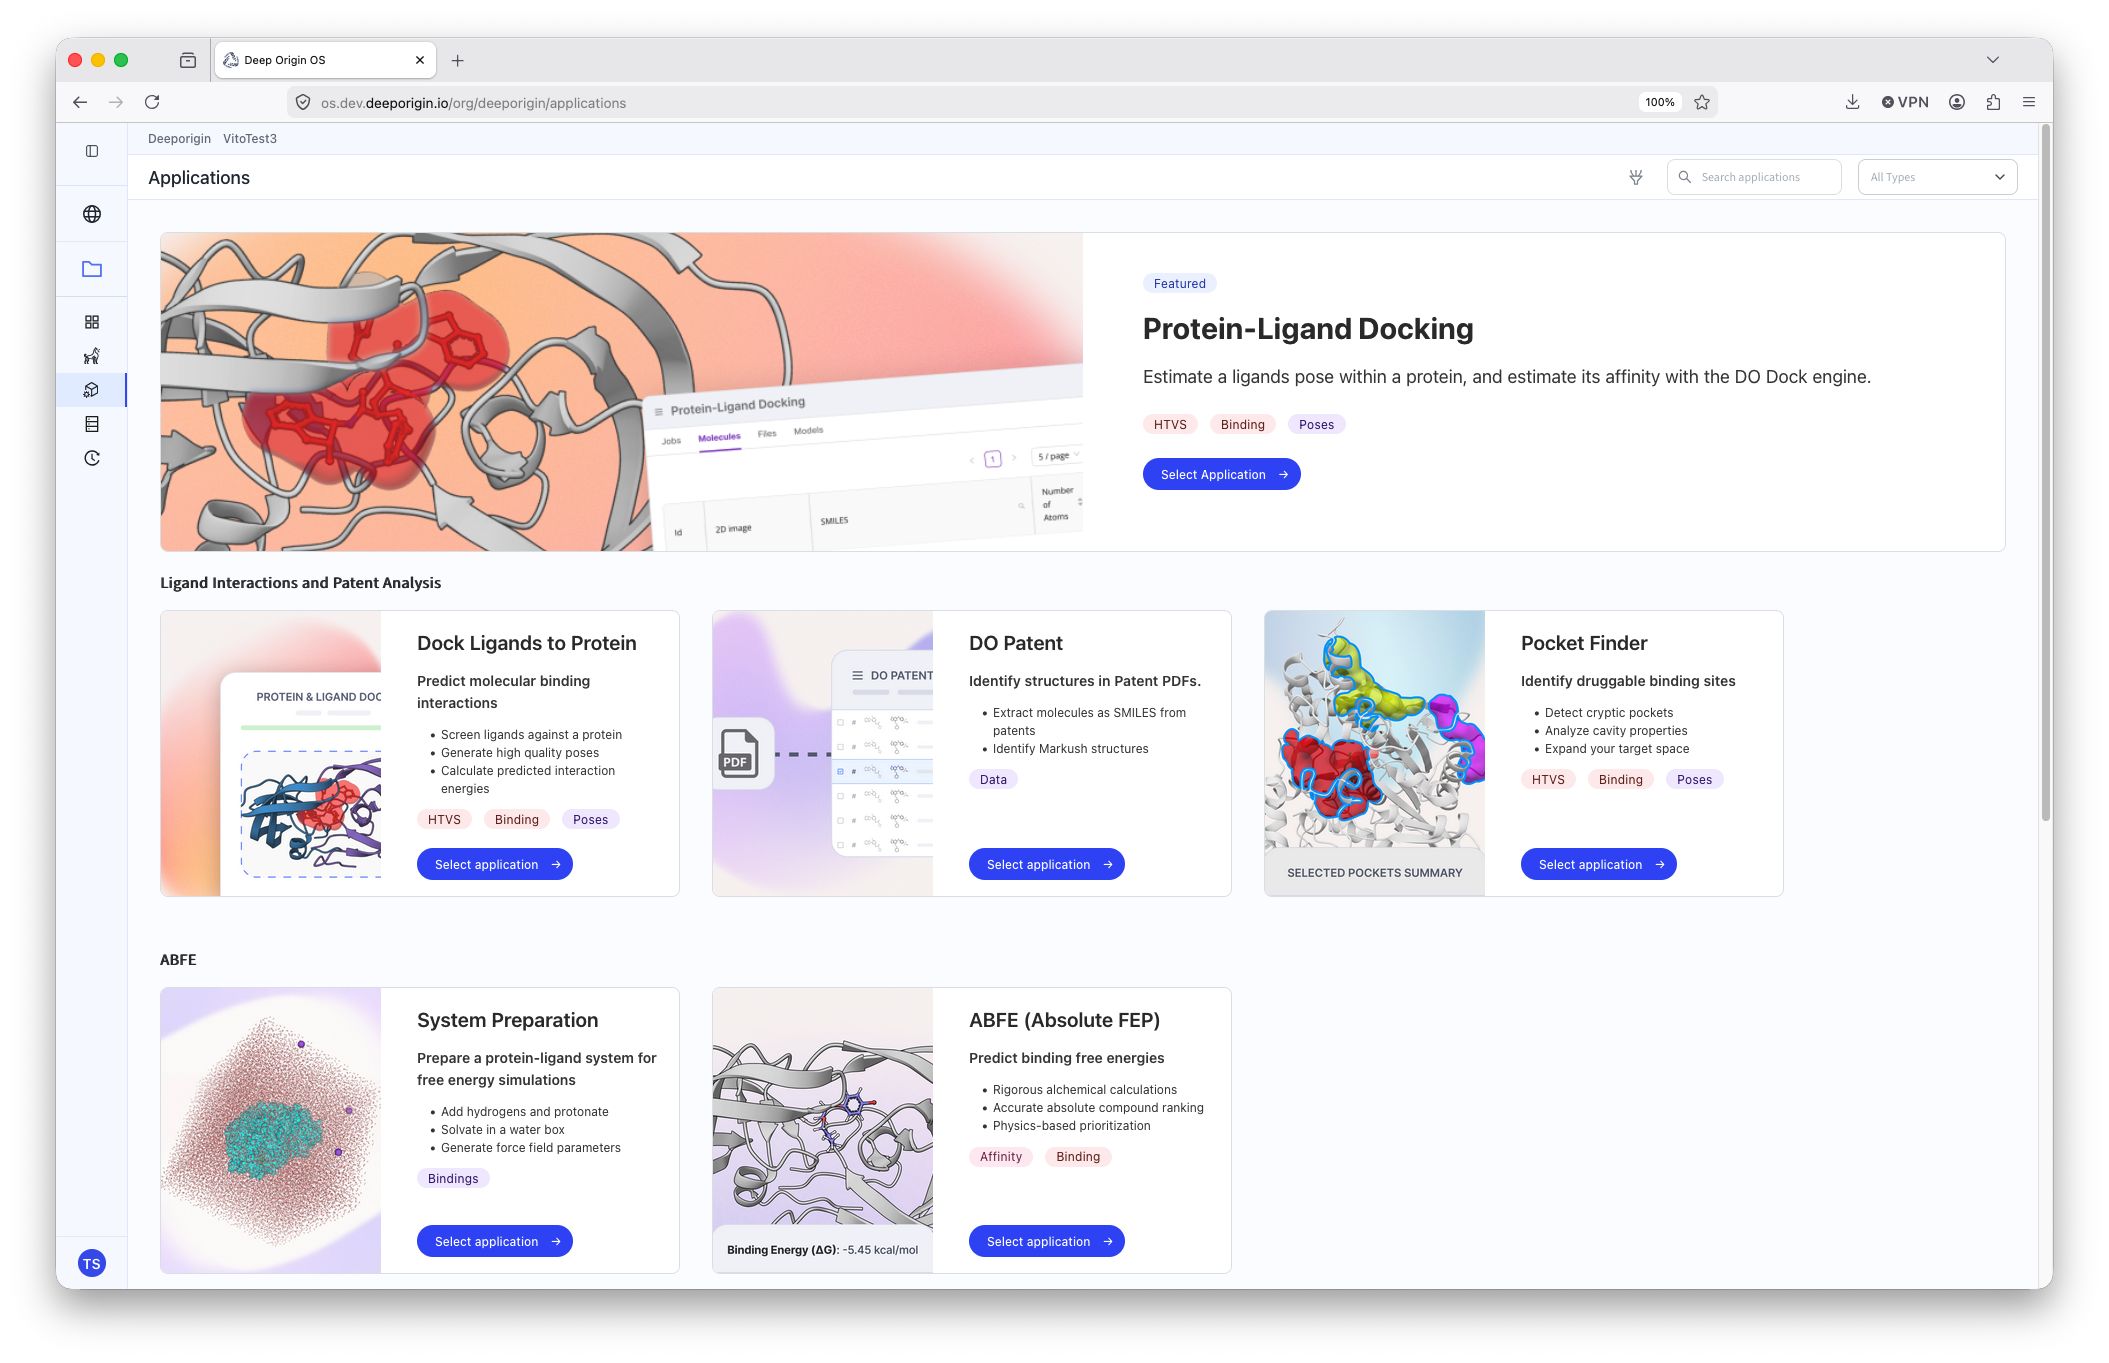
The application page lists all available applications, has short descriptions, and tags for relevant use-cases and outputs.
Pocket Finder
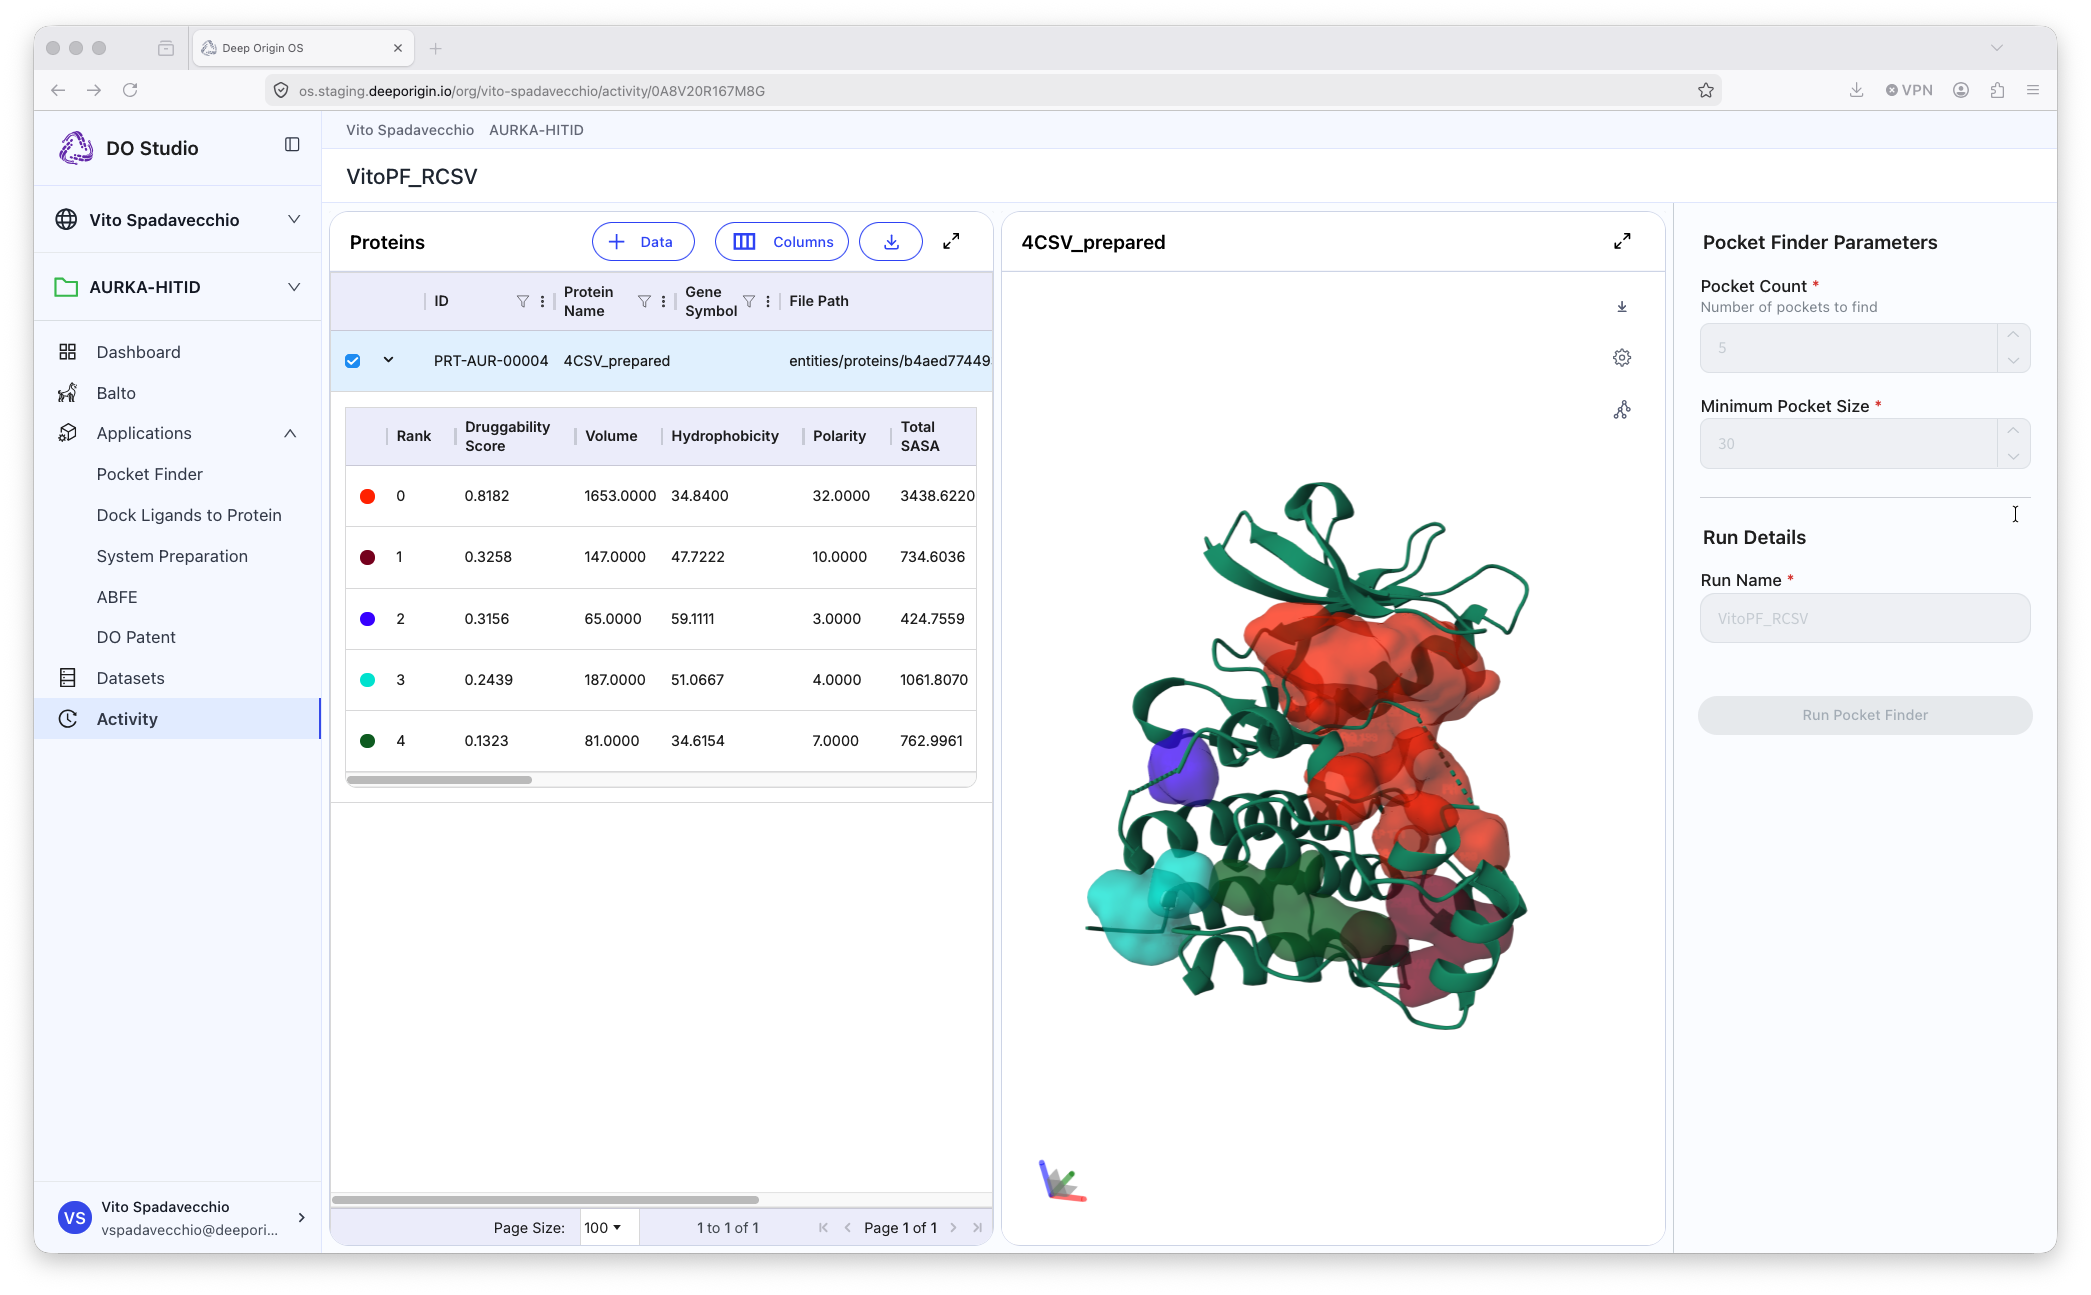
Example output from a Pocket Finder calculation
Pocket Finder identifies potential binding sites on a protein structure. These are regions that show high druggability and where small molecules can be docked.
Tool Summary
Requires:
- A protein in the Protein table
Outputs:
- Protein pocket(s), and pocket metadata (size, druggability)
📍 To run Pocket Finder, open the application, and:
- Select a protein from your protein table
- Set the appropriate parameters in the settings panel (right panel)
- Name the output of the calculation
- Submit the job
- To view the results, either:
- Press the “View Result” for the job record in the Activity page, or
- Open the Pocket Finder application, and select that row from the Protein table
DO Dock
DO Dock is a ML- and physics-driven docking method to predict the pose of a ligand to a protein, and its corresponding estimated binding energy, helping you evaluate and rank drug candidates based on estimated binding affinity.
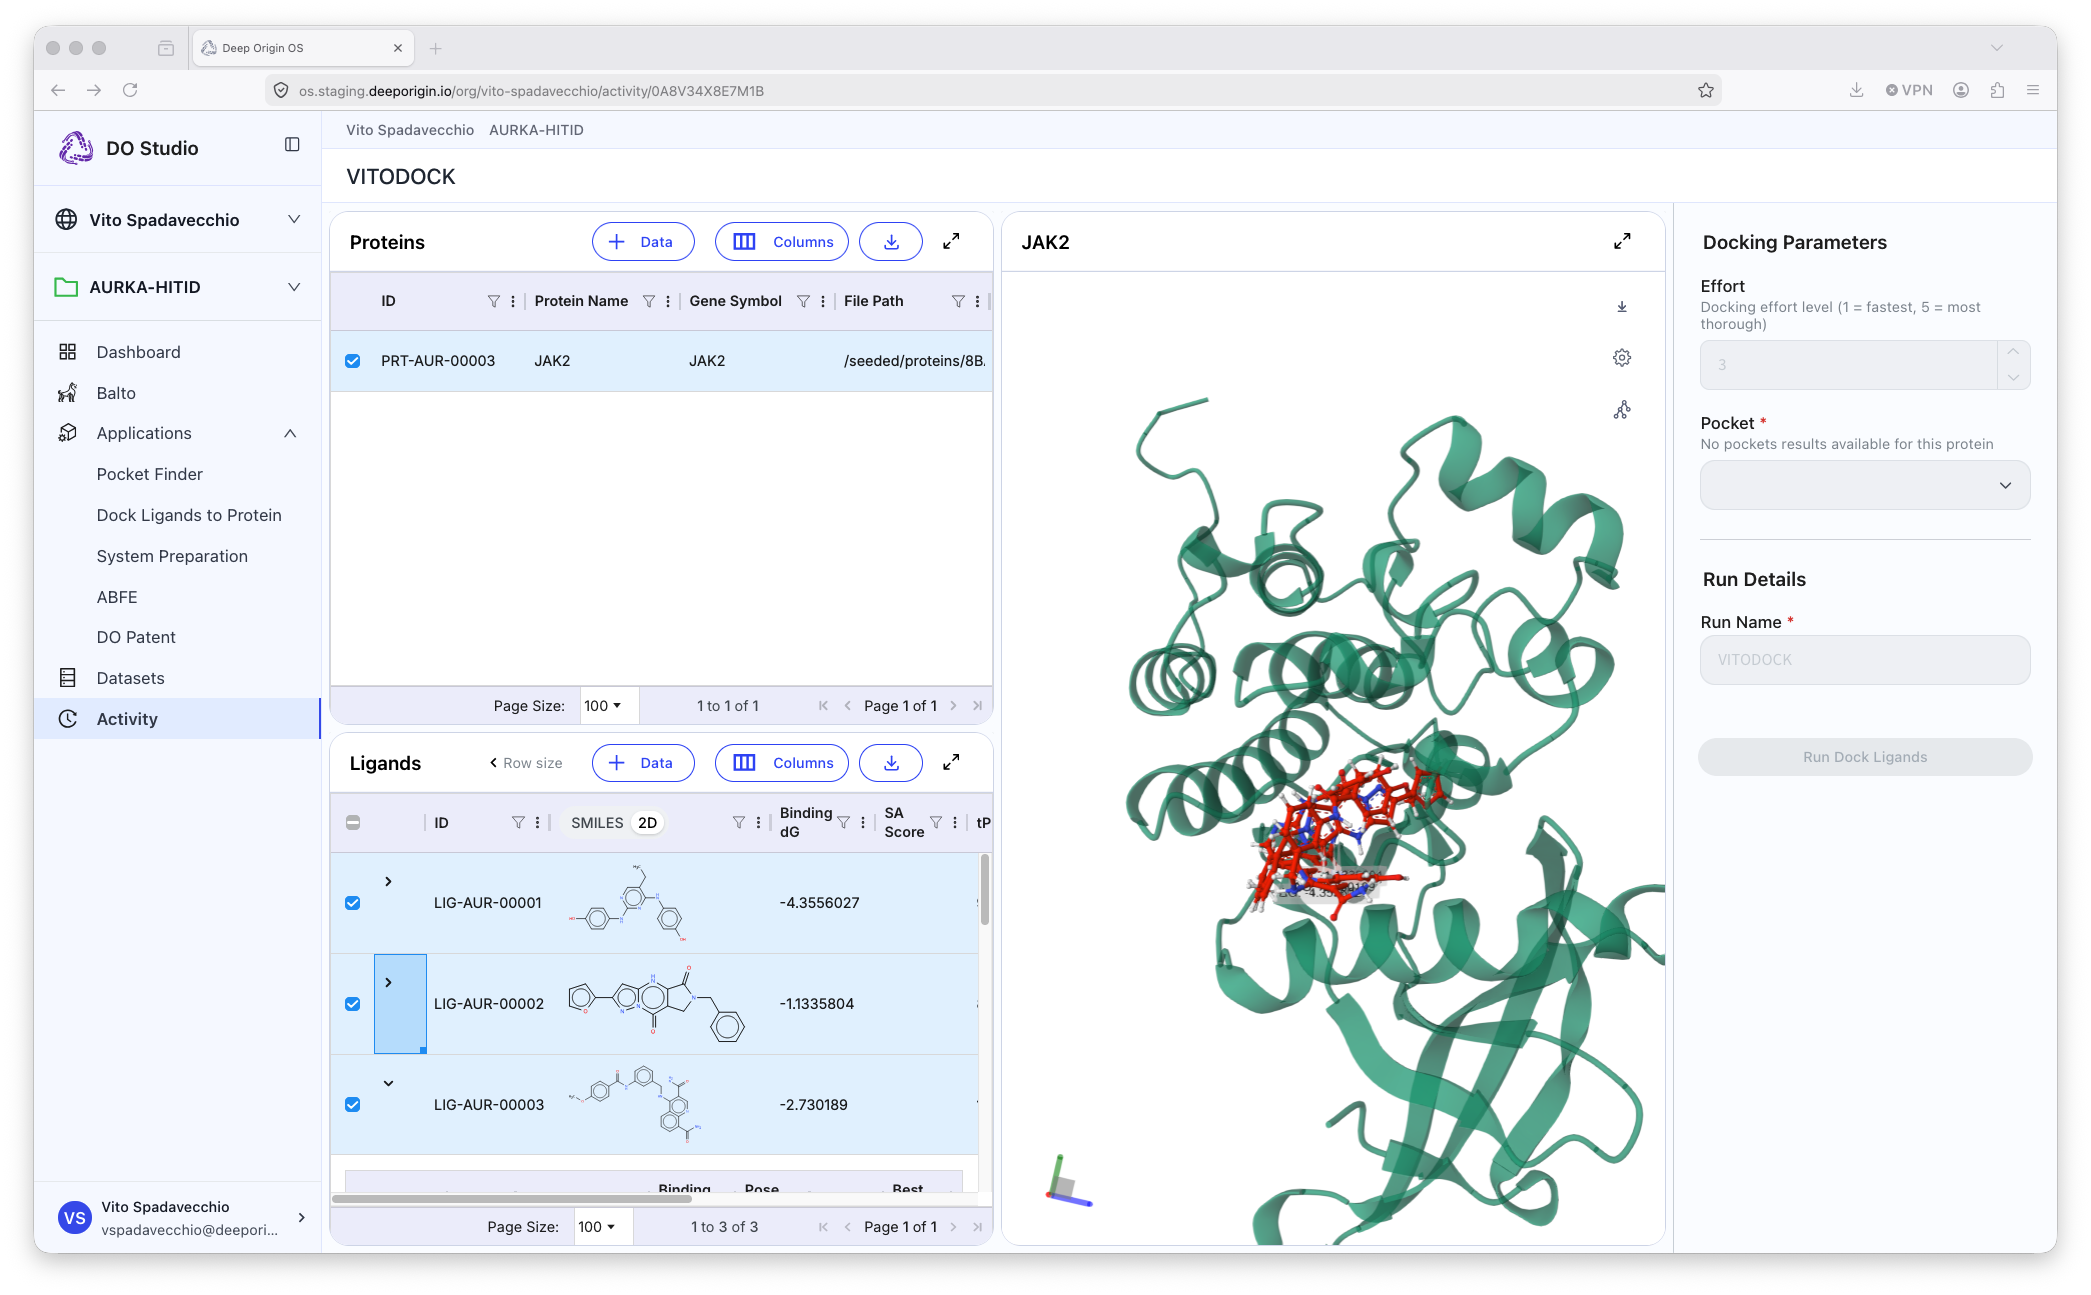
Example output of DO Docking application.
Tool Summary
Requires:
- A protein in the Protein table
- Protein pocket (from Pocket Finder application)
- Ligand(s) in the Ligand table
Outputs:
- Docked poses
- Pose scores
- Estimated binding energies
📍 To run DO Dock, open the application, and:
- Select a protein from your protein table
- Select the ligand(s) from the Ligand table to be docked
- Set the appropriate parameters in the settings panel (right panel)
- Name the output of the calculation
- Submit the job
- To view the results, either:
- Press the “View Result” for the job record in the Activity page, or
- Open the DO Dock application, select a row from the Protein table, and select ligand(s) to view poses and metadata
DO Patent
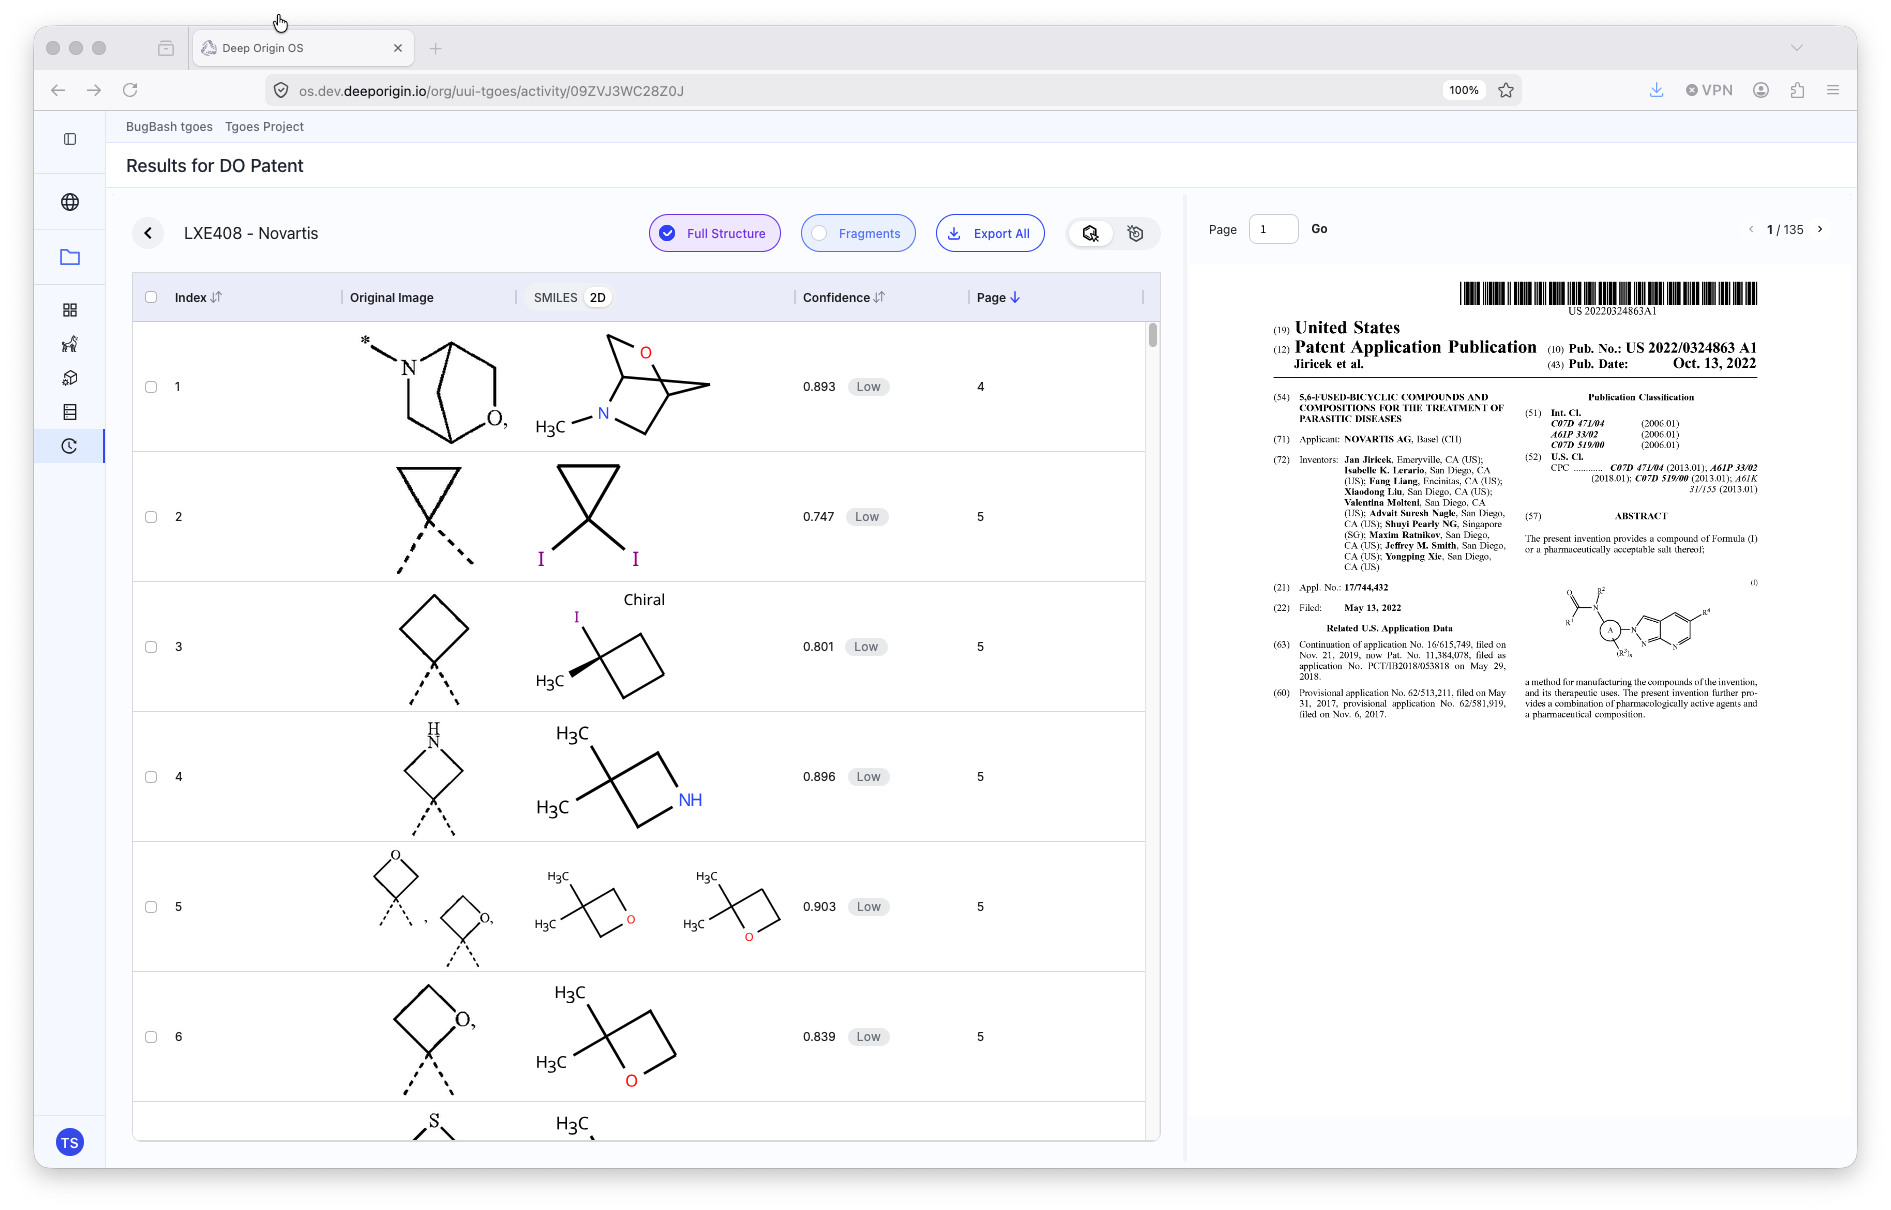
Directions on using DO Patent can be viewed in Deep Origin documentation here.
Tool Summary
Requires:
- A
.pdffile of the patent to be analyzed
Outputs:
- ML extracted images of molecules from the patent
📍 To run DO Patent, open the application, and:
- Drag-and-drop the
.pdfinto the main space of DO Patent- The job will automatically submit and can be tracked via the Activity Page
Balto
Directions on using Balto can be viewed in Deep Origin documentation here.
System Preparation
To run free energy perturbation (FEP) simulations, protein-ligand complexes must first be prepared by addition of waters, ions, and other necessary components. The System Preparation application performs this transformation, and creates all of the necessary files for FEP simulations.
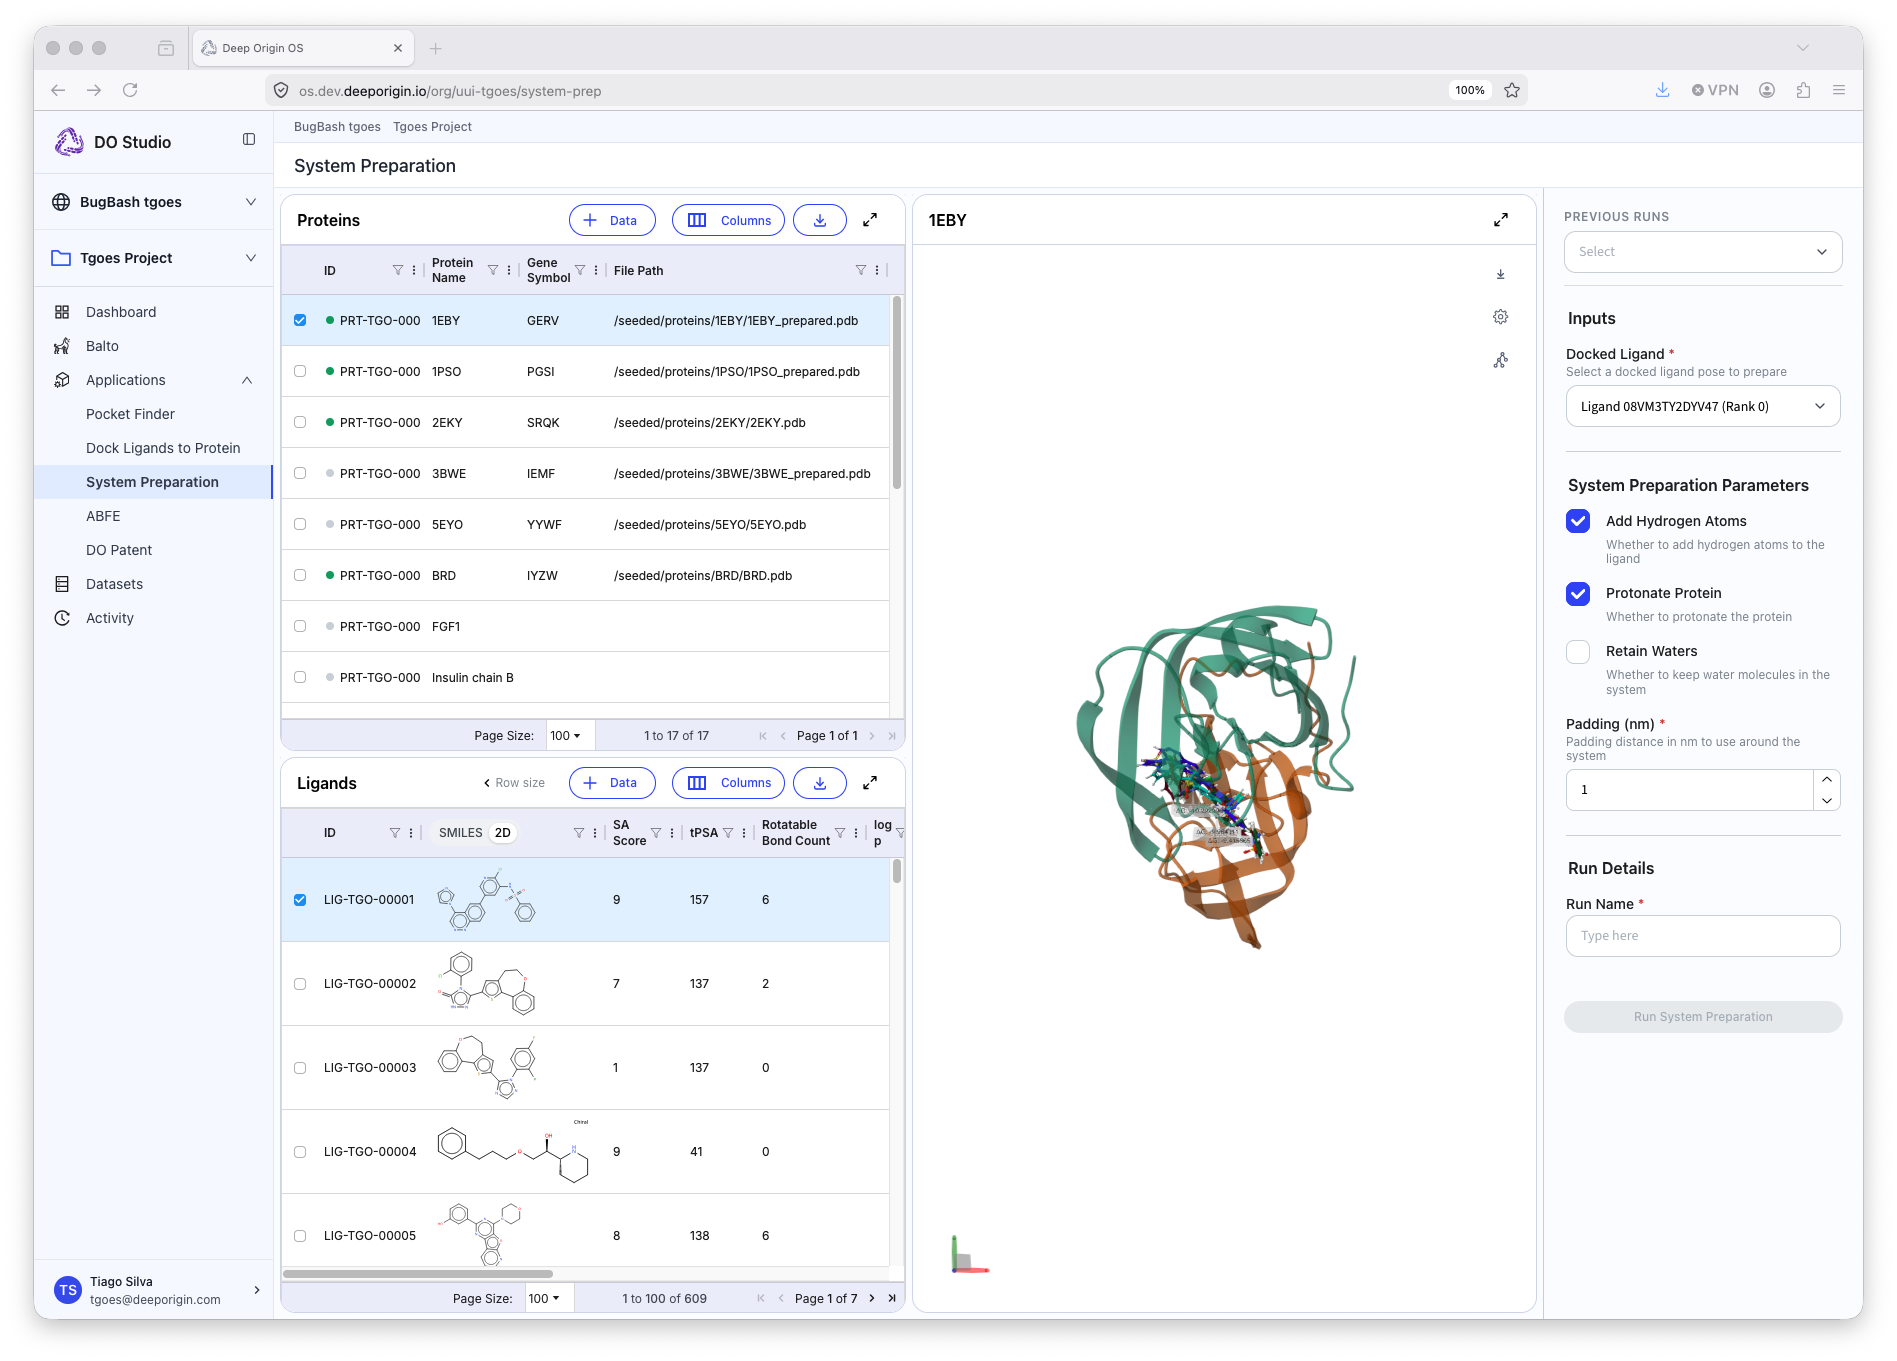
Tool Summary
Requires:
- A protein in the Protein table
- (Conditional) If docking ligands to protein, a Pocket Finder result is required
- Ligand(s) in the Ligand table with docked poses
- (Conditional) If existing poses do not exist, a DO Dock result is required
Outputs:
- Solvated system for ABFE simulations
📍 To run System Preparation, open the application, and:
- Select a protein from your protein table
- Select the ligand(s) from the Ligand tab
- Set the appropriate parameters in the settings panel (right panel)
- This includes which pose to use for the selected ligand
- Name the output of the calculation
- Submit the job
- To view the results, either:
- Press the “View Result” for the job record in the Activity page, or
- Open the System Preparation application, select that row from the Protein table, and select ligand(s)
ABFE (Absolute Binding Free Energy)
The ABFE (Absolute Binding Free Energy) application calculates binding free energies (dG) with high accuracy using rigorous physics based simulations.
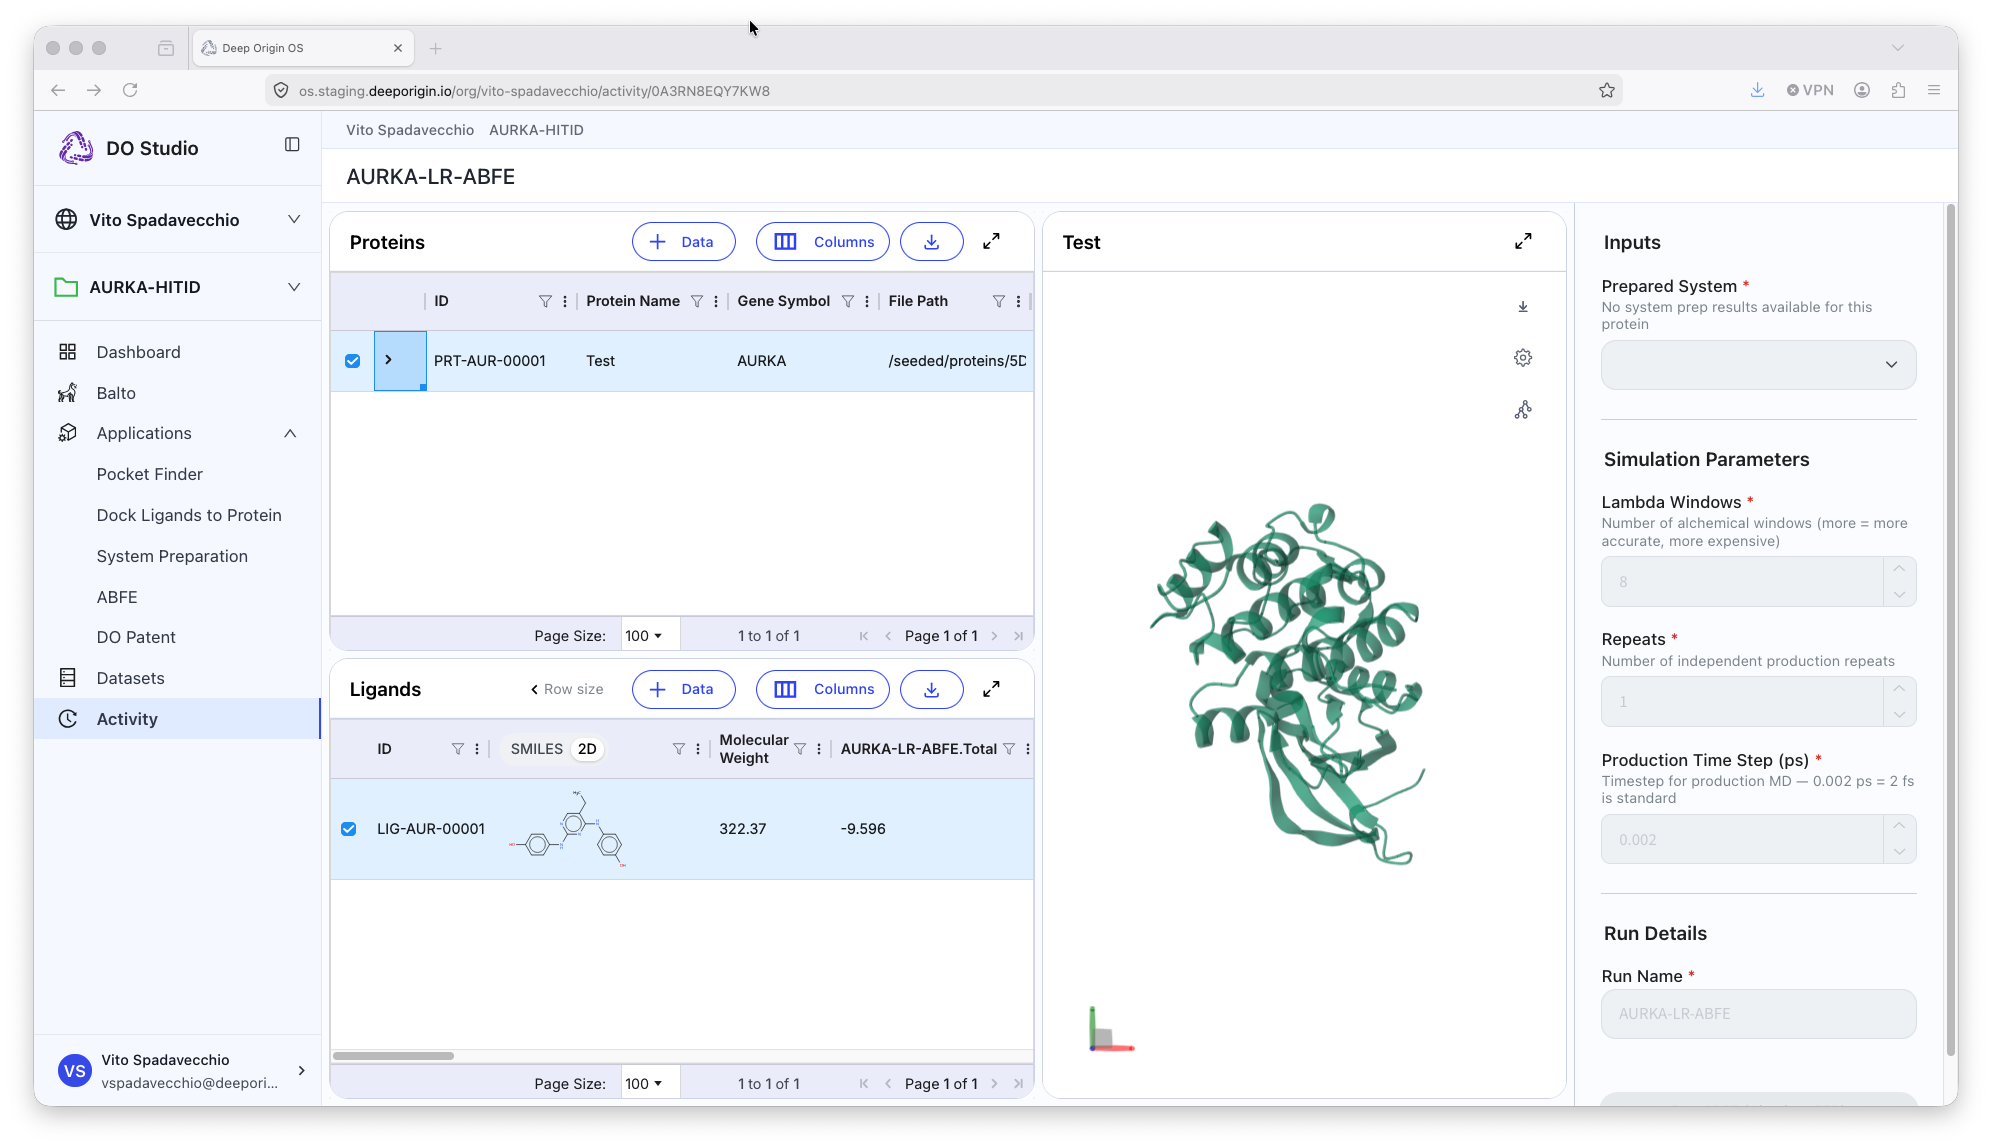
Tool Summary
Requires:
- A protein in the protein table
- Docked poses (either from DO Dock, or existing poses)
- A solvated system (from System Prep)
Outputs:
- Binding affinity (dG) estimates (and estimated errors)
- Simulation leg values and errors (e.g. solvation, binding)
📍 To run DO ABFE, open the application, and:
- Select a protein from the protein table
- Select Ligands that have a pose estimated
- Set the appropriate parameters in the settings panel (right panel)
- Use the solvated system from the output of the System Prep application
- Name the output of the run
- Submit the job
- To view the results, either:
- Press the “View Result” for the job record in the Activity page, or
- Open the DO ABFE application, select that row from the Protein table, and select ligand(s) to view dG values
7. Activity Page
The activity page contains records of the calculations and simulations you have run within your project.
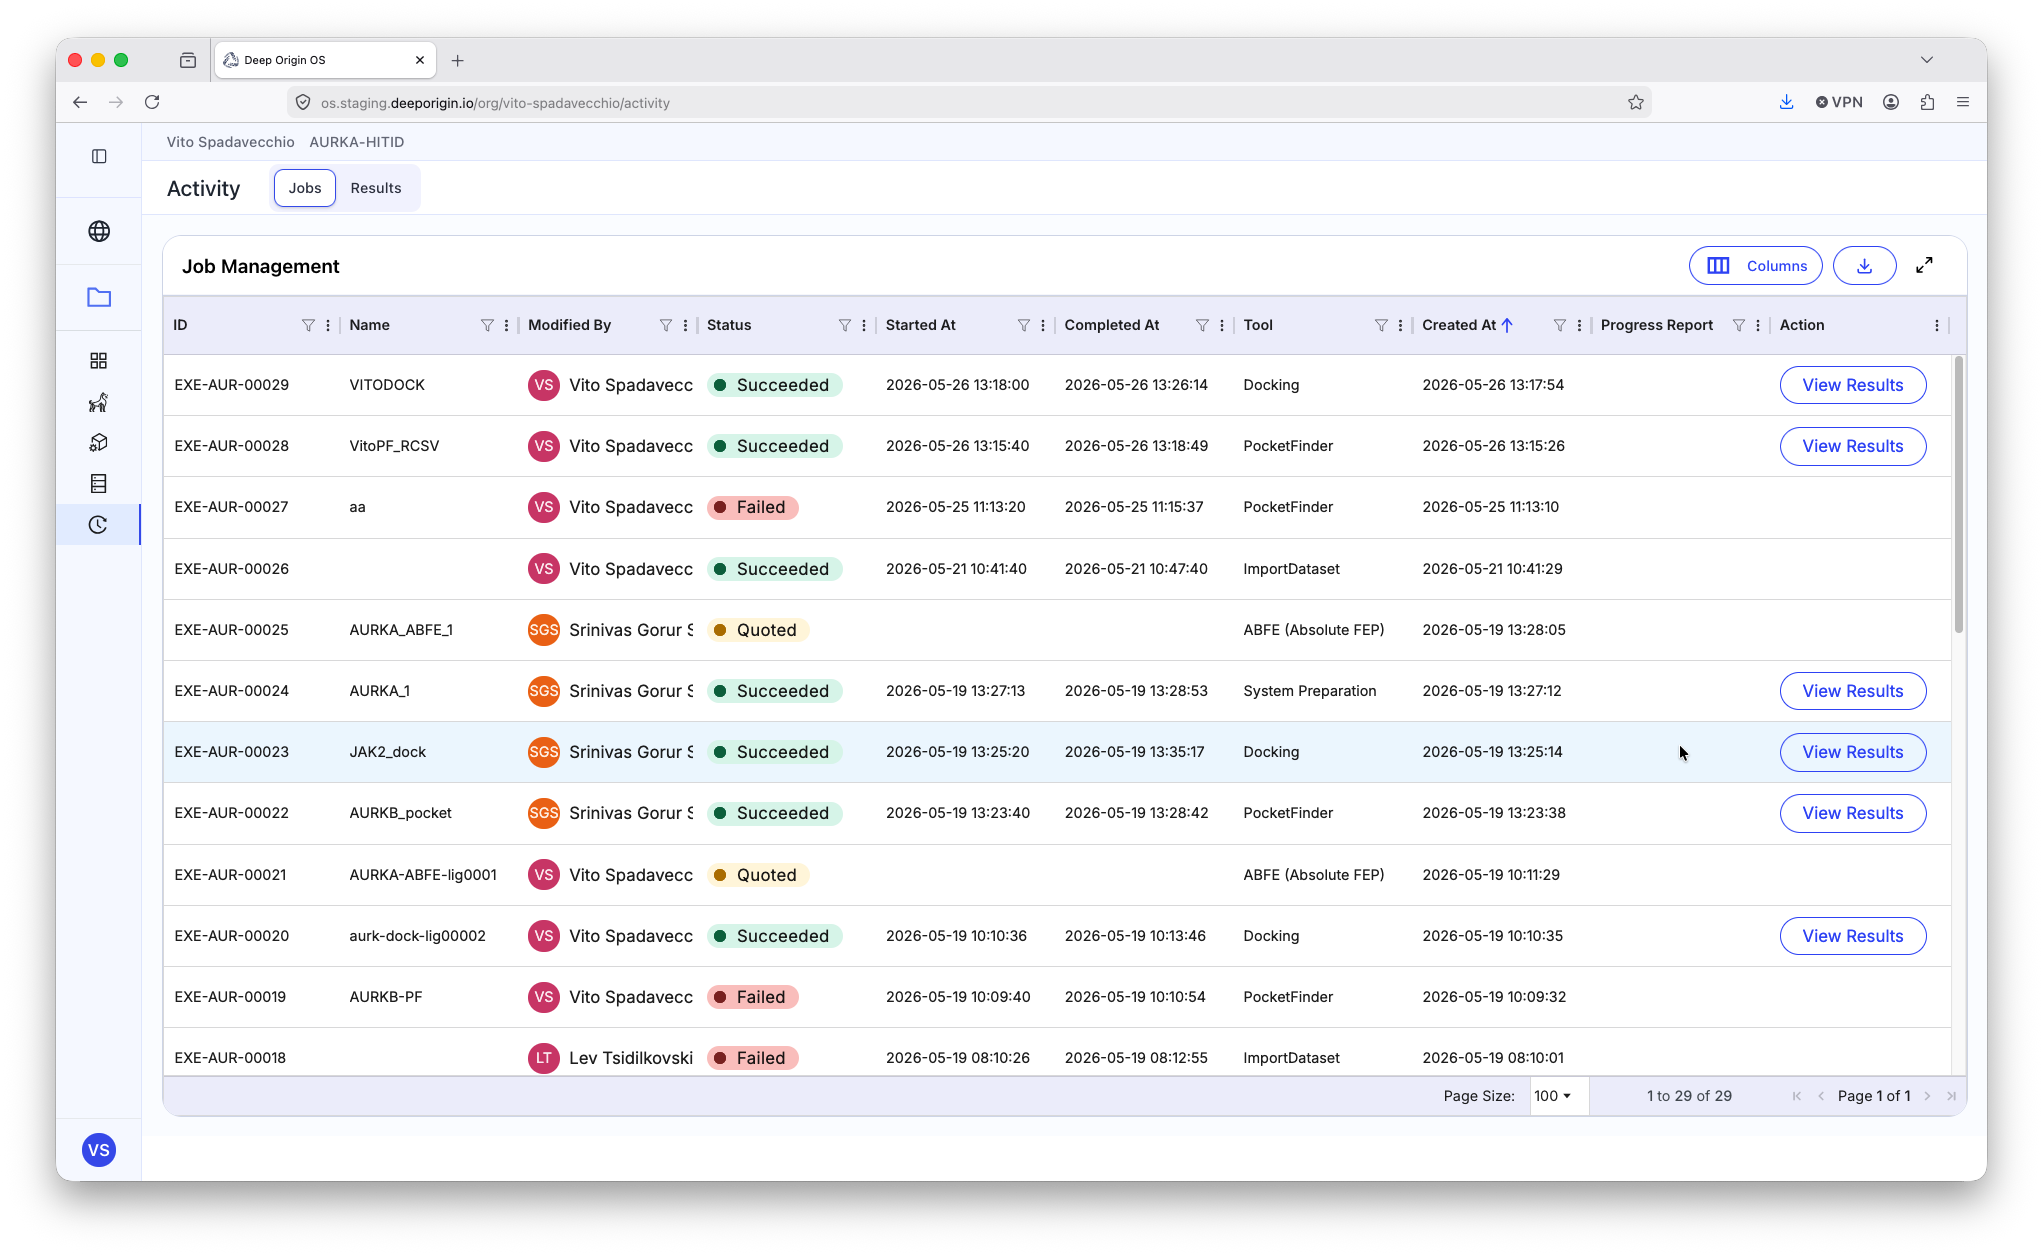
Each row represents a different calculation that has been submitted in the active project. The “Status” column contains multiple statuses:
🟢 Succeeded - The submitted job ran, and the results are available for review
🔴 Failed - The job failed or was cancelled by the user
🟡 Quoted - A quote was generated and is being processed by the billing platform
🔵 Running - The job is currently running
⚪ Insufficient Funds - The job was not run, as there were not sufficient funds available in the organization. (To learn more about billing, review Deep Origin Billing documentation)
Each row property (Name, Status, Tool, etc) can be filtered and filtered to identify specific jobs.
Canceling a Running job
To cancel a running job, go to the Activity page and identify the job you want to cancel. While the job is in the 🔵 Running status, press the “Cancel” button in the “Action” column.
❗Only jobs with the 🔵 Running status can be canceled.
Viewing the results of a Succeeded job
To view the results of a succeeded job, visit the Activity page and press the “View Results” button under the “Action” column. This loads the application that generated that result with any relevant parameters used.